Forensic pedology or soil forensics is a branch of forensic science that focuses on analyzing soil as trace evidence in criminal investigations. It involves studying soil properties, including texture, color, and chemical composition, to connect suspects, victims, or objects to specific locations.
In addition, analyzing soil layers can aid in pinpointing crime sites, burial sites, or environmental offenses. As expert witnesses, forensic pedologists testify in court, explaining the significance of soil evidence in the case.
However, soil forensics has limitations, as soil properties can change over time due to natural processes like weathering and erosion. Yet, if handled efficiently, the soil is proven to be a valuable piece of evidence in criminal investigations, shedding light on the circumstances and connections related to a crime.
Need of Soil Forensic Analysis
A. Need for Forensic Soil or Forensic Pedology Analysis:
- Comparative Analysis: Soil samples from a suspect’s garden were compared with soil found under a victim’s fingernails, revealing a match in mineral composition.
- Tracking Pollutants: Samples from a riverbed indicated elevated levels of industrial chemicals, tracing the source to an illegal dumping site upstream.
- Determining Burial Alteration: Soil samples from different depths at a potential burial site showed inconsistent layering, indicating recent disturbance.
- Study of Grain Size and Shape: The angularity of sand grains in a soil sample from a suspect’s shoes was consistent with sand from a specific desert area.
- Micromorphological Analysis: Thin section analyses of soil samples from crime scene searches revealed the presence of unique fungal spores, linking them to a specific location.
B. Need of Forensic Geology With Example:
- Mineralogical Identification: A rock sample from a robbery scene had a unique assemblage of minerals, which was matched to a specific lot of robbed crystals.
- Study of Microfossils in Rock Samples: Rock samples from a disputed land area contained microfossils of a specific age, determining the land’s geological history and influencing a legal decision.
- Texture and Structure Examination: The texture of a clay sample found in a suspect’s car was consistent with a clay deposit near the crime scene.
- Analysis of Anthropogenic Materials in Rock: Concrete samples from a collapsed building were analyzed and found to contain sub-standard materials, leading to an investigation of the construction company.
- Gemstone Source Determination: The inclusions and structural distortions in a gemstone sample helped determine its origin, revealing it was sourced from a conflict zone.
- Petrographic Thin Section Analysis: Petrographic analysis of thin sections from soil samples helped distinguish between volcanic ash layers from two different eruptions in a region.
Basics of Soil Forensics and Forensic Pedology
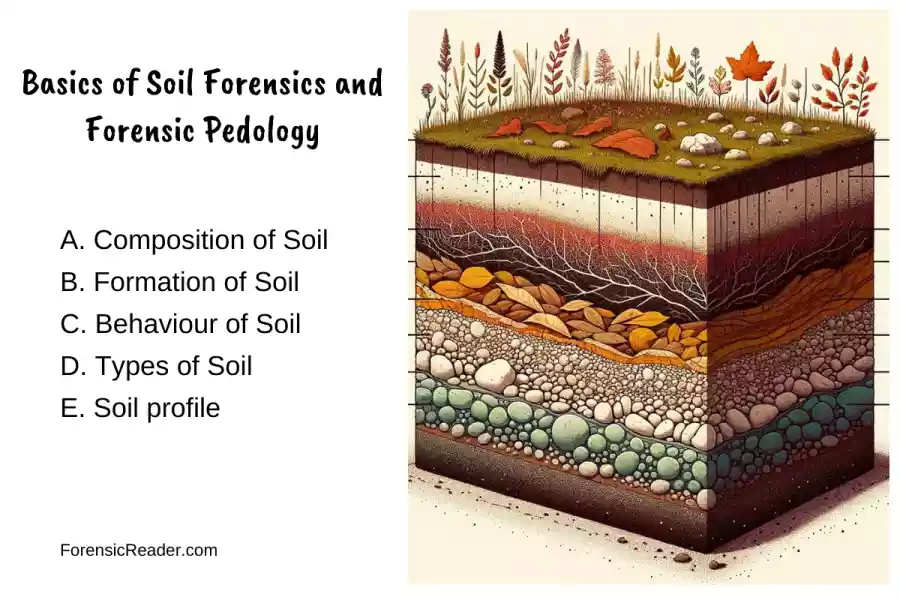
A. Composition of Soil
Soil is a mixture of minerals, organic material, and living organisms. In a broader sense, it can encompass any loosely packed sediment. Soil typically consists of:
- Minerals: making up approximately 45% of its composition.
- Void spaces: taking up about 50%.
- Organic matter: accounting for roughly 5%.
This composition acts as a growing medium for plants, stores minerals and nutrients helps in the recycling of various micro and macronutrients, maintains atmospheric cycles, and is an integral part of the biosphere.
B. Formation of Soil
Soil formation results from the natural weathering of rocks. There are three types of weathering processes:
- Mechanical Weathering:
- Location: Predominantly observed near the Earth’s surface.
- Also known as Physical weathering.
- Driving Forces: It’s governed by physical forces such as wind, water, and temperatures.
- Chemical Weathering: This is when rocks break down due to chemical reactions, changing their core composition.
- Biological Weathering or weathering by living organisms. These organisms play a part in weakening and eventually subsequently breaking down rocks.
C. Behaviour of Soil and pH Levels
Soil responds to external forces, variations in moisture and pH levels, and other environmental factors in different ways[1]. This behavior is unique and relies on a multitude of elements including soil type, structure, compaction, moisture content, and load history.

Key Influencers on Soil Behavior:
- Soil Type: Different soils (like clay, silt, or sand).
- Structure: The arrangement and alignment of soil particles.
- Compaction: How densely the soil is packed affects its behavior.
- Moisture Content: The amount of water present can drastically change how soil reacts.
- Load History: Past pressures and loads on the soil can influence its present state.
Oberveable Soil Behaviors
- Strength: Soil’s ability to withstand external pressures.
- Compression: How much a soil sample decreases in volume under pressure.
- Consolidation: This refers to the soil’s settlement due to consistent compression.
- Liquefaction: A phenomenon where the soil exhibits liquid-like properties, often triggered by events like earthquakes.
- Permeability: It’s all about how water moves through the soil, indicating its porosity and connectivity.
D. Types of Soil
A basic understanding of soil fertility, but it was not until the 19th century that a more scientific classification of soil was developed.
| Type of Soil | Composition | Geographic Locations (USA, Canada, & India) |
|---|---|---|
| Alluvial Soil | Rich in silt, clay, and organic matter; low in N, P, and K. | Mississippi River Valley (USA), Central Valley (USA), Indo-Gangetic Plain (India). |
| Black Soil | Rich in clay, calcium carbonate, and iron oxides; low in organic matter. | Midwest USA, Deccan Plateau (India), Krishna Valley (India). |
| Red and Yellow Soil | Rich in iron and aluminum oxides; low in organic matter, N, and P. | Southeastern USA, Piedmont Region (USA), Peninsular India. |
| Laterite Soil | Rich in iron and aluminum oxides; low in organic matter, N, P, and K. | Florida (USA), Western Ghats and Eastern Ghats (India). |
| Arid and Desert Soil | Sandy; low in organic matter, N, P, and K. | Southwestern USA, Mojave Desert (USA), Rajasthan (India). |
| Saline and Alkaline Soil | High in salts and sodium ions. | Great Plains and North Dakota (USA), Coastal India. |
| Peaty and Marshy Soil | Rich in organic matter; low in minerals. | Northern Midwest and Florida Everglades (USA), Northeast India. |
| Forest and Mountain Soil | Varies based on elevation, climate, and vegetation. | Appalachian Mountains and Rocky Mountains (USA), Himalayas (India). |
| Mollisols | Rich in organic matter; found in grasslands. | Great Plains (USA), Midwest USA, Northern Prairie Provinces (Canada). |
| Spodosols | Sandy, with a layer of accumulated organic matter and iron/aluminum oxides. | Northern USA, Pacific Northwest (USA), Northeast Canada. |
| Alfisols | Moderately leached with some clay accumulation; fertile. | Midwest USA, Pacific Northwest (USA), Southern Ontario (Canada). |
E. Soil profile
Soil is made up of different layers, or horizons, each with its own unique characteristics. These horizons are stacked on top of each other to form a soil profile, which is like a biography of the soil.
| Horizon | Description |
|---|---|
| O Horizon | Organic matter horizon; is mostly composed of decomposing leaves, twigs, and other plant and animal residues. |
| A Horizon | Topsoil horizon; contains a mixture of organic matter and mineral particles. |
| E Horizon | Eluviated horizon; leached of clay, minerals, and organic matter, leaving a concentration of sand and silt particles. |
| B Horizon | Subsoil horizon; enriched with minerals that have leached down from the A and E horizons. |
| C Horizon | Parent material horizon; the underlying material from which the soil has formed. |
| R Horizon | Bedrock horizon; the solid rock underlying the soil profile. |
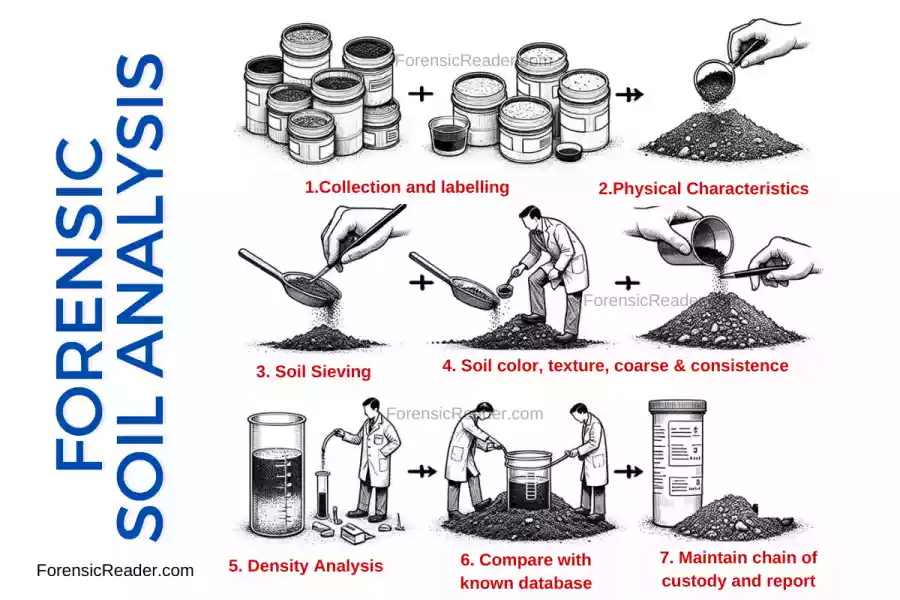
14 Techniques for Analyzing Soil in Forensic Science
| Characteristic | Description | Methods of Analysis |
|---|---|---|
| Color | Determines soil type, mineralogy, and organic content. | Munsell soil color charts (hue, value, chroma). |
| Texture | Defined by size and distribution of particles. | Hydrometer method, sieve analysis. |
| Structure | Refers to particle arrangement. | Optical/electron microscopes, visual examination, thin section analysis. |
| pH | Measures soil’s acidity or alkalinity. | pH meter, soil test kit. |
| Organic Matter | Decaying remains of plants and animals. Darker color indicates higher content. | Loss-on-ignition method, Walkley-Black method. |
| Mineral Composition | Defined by parent material. Common minerals: quartz, feldspar, mica, clay. | X-ray diffraction, scanning electron microscopy. |
| Biological Activity | Ecosystem with organisms like bacteria, fungi, insects, and earthworms. | Microbial biomass carbon, dehydrogenase activity method. |
| Density | Mass of soil per unit volume. | Density gradient tube: layers of varying density liquids are added, soil samples settle in matching density layers[5]. |
| Refractive Index | Measure of how much a substance bends light. Depends on mineral composition and organic content. | Refractometer. |
1. Color Analysis in Soils
Soil color remains the initial property recorded in soil descriptions. It acts as a redox status indicator, linked to soil aeration and organic matter content.
- Three main objective notions for soil color coordinates:
- Hue (Shade): Color frequency in soils, generally ranging from red to yellow.
- Value (Lightness): Refers to brightness, from white to black.
- Chroma (Intensity): Describes the color saturation or hue intensity.
Determining Soil Color Using Munsell Soil Color Chart:
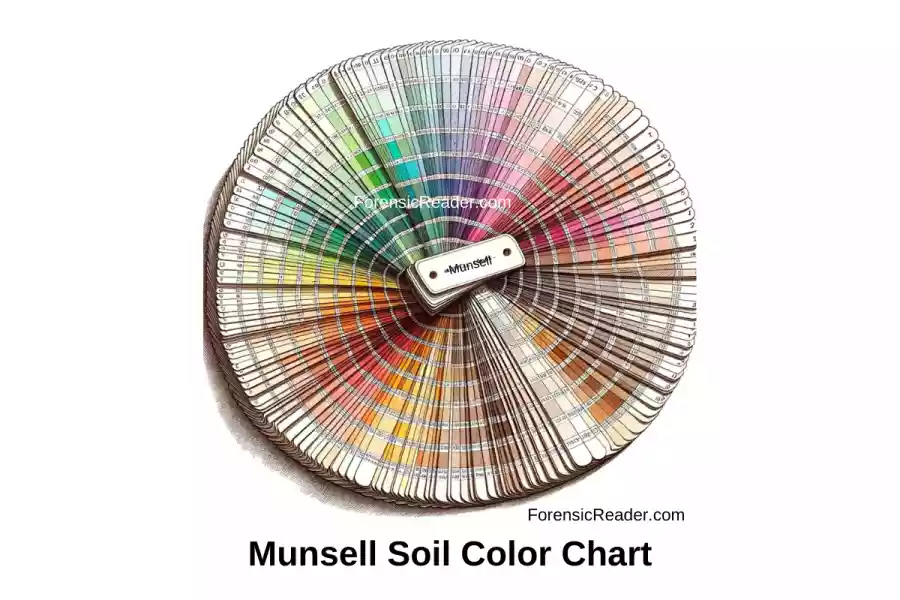
Determined on both dry and moist samples using the Munsell Soil Color Charts (1994). Soil Matrices Descriptions:
- Red: Hues 5 YR or redder with chroma > 1.
- Reddish: Hues 7.5 YR with chroma > 1.
- Yellow: Hues 7.5 YR or yellower.
- Dark colors: Value < 3 and chroma < 2.
Determining the Redox Potential Reaction of Soil
- Soils are subject to variation in oxidation-reduction (redox) status and this is mainly affected by iron oxides present and also other elements C, N, O, S, and Mn.
- Their position in landscapes is related to soil aeration and organic matter.
Calculating Redox potential (Eh) using a Pt electrode and a calomel electrode connected to a millivolt meter (but suffers accuracy).
- Anaerobic soils have values from +118 to -414 mV (pE +2 to -7)
- Measurement of Eh can be used to determine whether oxidizing or reducing condition exists, but frequently soil colors provide a good indication.
Example:
- Red and brown colors indicate the oxic condition.
- Blue-green and grey colors indicate gleyed soil (an indication of low Fe-oxides owing to the redox process).
Factors Influencing Soil Color
A. Constituents:
- Amount and types of organic substances.
- Nature of the minerals present.
- Oxidation and reduction processes of iron.
B. Iron Oxide’s Impact:
- Influences soil chemistry.
- Phosphate adsorption is higher in yellow (goethite-rich) soils than in red (hematitic) soils.
- Soil color can forecast phosphate application needs, particularly in regions where yellow soils align with soil P sorption.
C. Dependence on Environmental Conditions
- High chroma colors (red/yellow) suggest oxidizing conditions.
- Low chroma shades (gray/blue tints) indicate waterlogged or reducing environments.
- Mixed bright red/yellow with gray/blue blotches represent periodic water saturation.
- Generally, red soils offer better drainage than their yellow counterparts.
2. Soil Consistence
Soil consistence serves as an indicator of the soil’s strength and coherence. It is also termed as soil consistency or rupture resistance.
Methods of Analysis:
- Observing a soil sample by hand.
- Gauging the force required for disruption or distortion. Soil samples, ideally block-like and sized between 25mm to 30mm on the edge, are used for this.
- The applied stress focuses on the vertical in-plane axis, either compressed between thumb and forefinger, both hands or foot against a solid flat surface.
Depending on moisture levels, different terms describe soil consistence. For example:
- “Soft” is used for dry samples.
- “Friable” for moist ones.
3. Particle Size Analysis of Soil as Evidence
Particle size, or texture, measures the particle size of sediment which is majorly influenced by erosive processes, transport, and sedimentation.
Procedure for Granulometric Separation (Sieving Method for Soil Analysis)
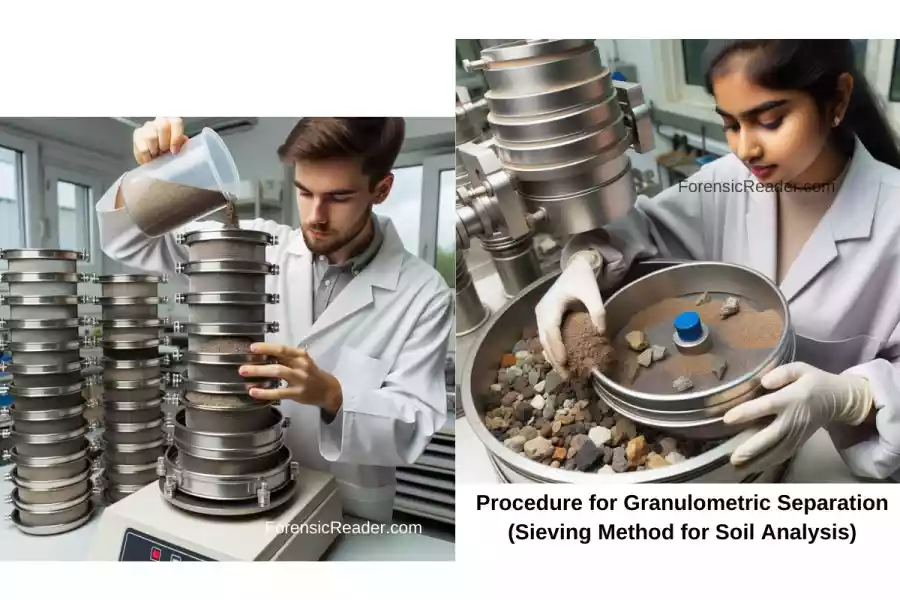
- Sample Collection: Collect a soil sample.
- Initial Treatment: Soil samples are soaked in water and subjected to ultrasound to dispel apparent cohesion.
- Separation:
- Particles are then separated using a sieve tower, which has standardized mesh sizes that decrease.
- These sieves, placed on a vibrating machine, allow soil particles to settle through mesh based on size.
- Weight Percentage Calculation:
- Each fraction passing through a specific sieve is weighed.
- The weight ratio of these fractions to the total sample weight, multiplied by 100, gives the particle size percentage.
Note:
Sieving generally is done down to the sand or silt sizes. Modern sieves with mesh sizes of 4 μm allow for the separation of the soil’s clay fraction in water.
Alternative methods, such as particle size analysis by sedimentation (or aerometry), operate on Stokes’ law. This method gauges particle diameters by their precipitation speeds in water.
4. Soil Texture
The soil’s texture is determined by the proportion of gravel, sand, silt, and clay.
Classification by Soil by Size (Wenthworth’s Classification)
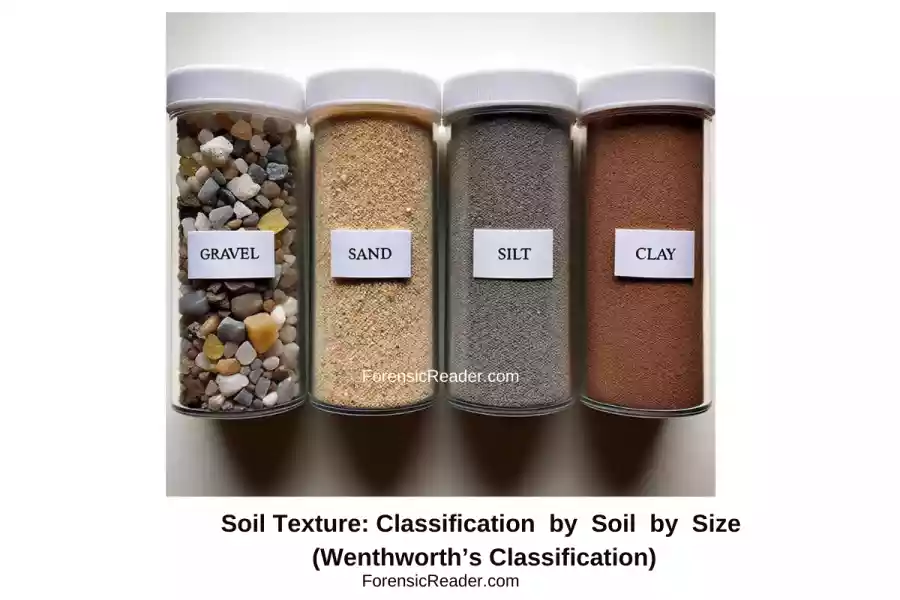
- Gravel: Particles with a diameter greater than 2 mm.
- Sand: Particles ranging from 0.0625 mm to 2 mm in diameter.
- Silt: Particles between 0.0039 mm and 0.0625 mm.
- Clay: Particles smaller than 0.0039 mm in diameter.
Different soils possess varied textural representations based on these proportions, such as “clay soil”, “gravel-sand”, “sandy-silt”, and so on.
Determining Soil Texture in the Field
- Sample Collection: Collect a soil sample that can comfortably fit in the palm and remove gravel and stones.
- Moistening:
- Gradually moisten the soil until it sticks to the fingers without becoming mushy. This state represents the soil’s field capacity.
- Continue this process until there’s no discernible change in the soil ball, typically within 1-2 minutes.
- Ribbon Creation: Try forming a ribbon by shearing the soil ball between the thumb and forefinger.
- Texture Analysis: The soil’s behavior and the ribbon length help determine its texture grade.
Why Does Soil Texture Matter?
- Water & Nutrient Retention:
- Coarse-grained sands: Possess large pores, leading to rapid drainage and a reduced capacity to retain water and nutrients.
- Loamy sands: Have better water and nutrient retention abilities.
- Clays: Offer high available water capacity and nutrient retention.
- Depth to Restrictive Layers:
- Factors such as subsurface compaction or structural decline can influence root growth and water movement.
- Generally, sandy soils are more susceptible to subsurface compaction compared to finer-textured soils.
- Erosion Vulnerability:
- Sand: Prone to wind erosion.
- Grain Size: Plays a role in erosion susceptibility. While fine sand grains are wind-mobile, coarser grains need more force to be dislodged. Clays, though light and transportable, often stay in place due to binding.
5. Soil Structure Analysis
Soil structure pertains to the arrangement and binding of soil particles (refer to Schoeneberger et al. 2002).
Key Characteristics
- Peds (granular, lenticular, platy, blocky, polyhedral, columnar, and prismatic)
- Single Grain or Structureless: Absence of aggregated soil particles; the particles exist as individual entities, appearing loose and incoherent.
- Massive: The majority of the soil (around two-thirds) exists as one large block, with particles firmly bound together, exhibiting coherence.
- Slickensides: Shiny, cracked, or grooved clay surfaces. Reflect planes of weakness in medium-to-heavy clay soils, allowing movement during the shrink-swell process.
- Characteristics include:
- Appearance as cracked, polished, or grooved surfaces.
- Size ranges from 10 mm to 200 mm.
- Possible movement up to 25 mm per year.
Importance of Soil Structure
- Profile Hydrology & Root Penetration: The size, shape, and nature of soil aggregates significantly influence water movement in the soil profile and root growth.
- Natural Aggregates – Peds:
- When soil particles cluster in naturally occurring aggregates separated by spaces, the soil is said to have structure.
- The extent and kind of structural development are primarily influenced by clay mineralogy and organic matter.
- Peds are formed from natural subdivisions in the soil, resulting from fine cracks. These subdivisions can range from small (like granular) to large blocks (such as columnar).
- Slickensides: These are indicative of the soil’s potential to shrink and swell, affecting its permeability to water, especially when moist.
6. Segregations and Coarse Fragments
- Segregations: Accumulations of distinct mineral particles, such as iron oxides, calcium carbonate, and gypsum, which have developed within soil.
- Coarse Fragments: Defined as rock fragments, strongly bound soil materials, and hard segregations that are more substantial than 2 mm in size.
Characteristics of Segregations
- Variability: Found in different sizes, shapes, and forms. They can be both soft and hard.
- Occurrence: Common in various parts of the world.
- Influence: Can significantly impact soil’s chemical and physical properties.
Common Segregations of soils are Calcium Carbonate and Gypsum along with test.
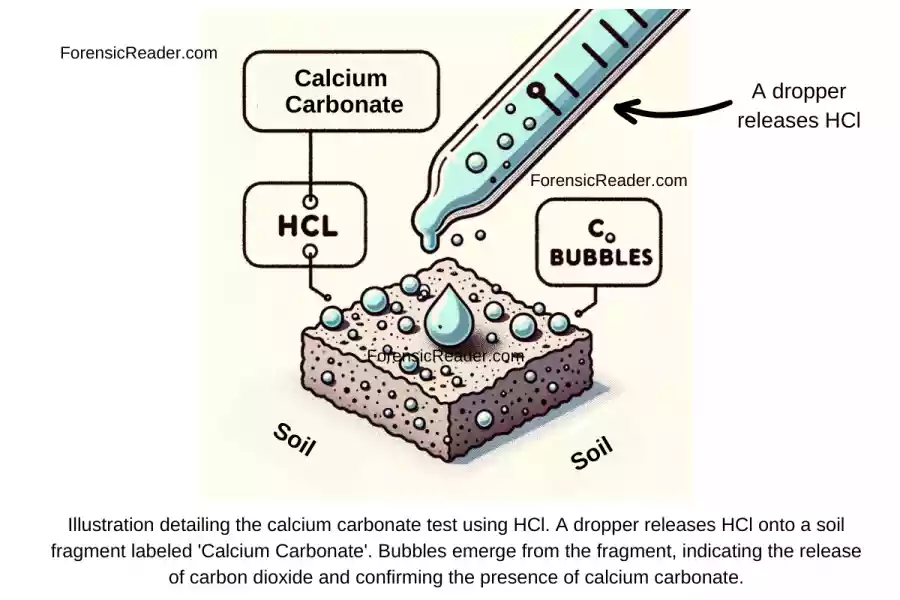
A. Calcium Carbonate:
- Appears primarily as masses and nodules.
- To identify its presence in the soil, Hydrochloric acid (1M HCl) is often applied. This interaction between the acid and soil carbonate results in effervescence, a phenomenon termed the “fizz test” (refer to Schoeneberger et al. 2002).
B. Gypsum:
- Typically seen as sparkling crystals.
- Predominantly found in regions with lower rainfall.
- Its presence often signifies elevated electrolyte concentrations in soils.
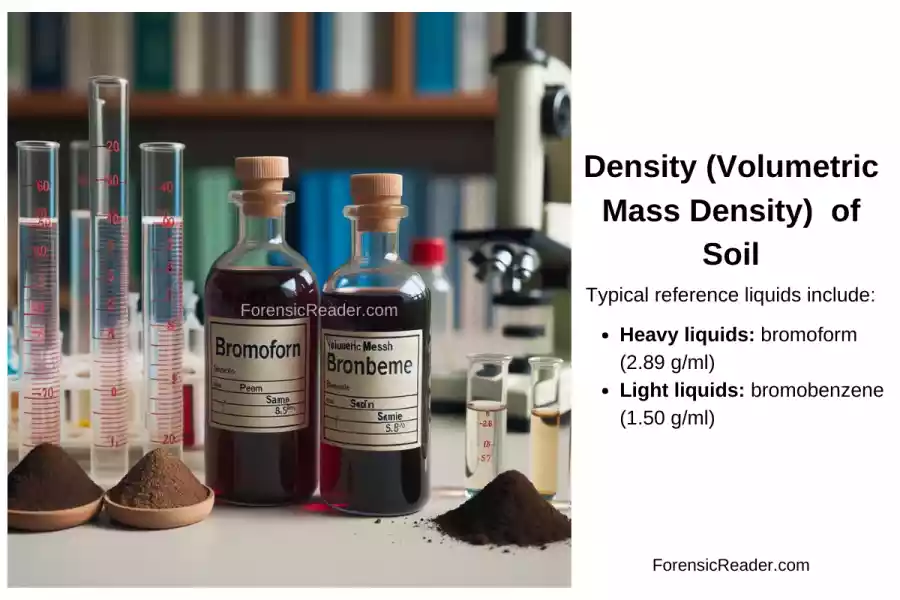
7. Density Analysis of Soil
Density (Volumetric Mass Density) denotes the ratio of the mass of a body to its volume. Inorganic particles in soil, such as minerals and rocks, and other geological materials have densities dependent on the spatial distribution of their atoms.
Forensic Laboratory Techniques for Soil Density Analysis
Forensic labs have used density division of particles and aggregates to compare soil samples for approximately 50 years.
Procedure:
- A tube is filled with liquids of different densities, with the heaviest at the bottom and the lightest at the top.
- Typical reference liquids include:
- Heavy liquids: bromoform (2.89 g/ml) or tetrabromoethane (2.96 g/ml).
- Light liquids: bromobenzene (1.50 g/ml) or ethanol (0.789 g/ml).
- Soil samples are dried, homogenized, and introduced into the tube.
- Here, particles get separated based on their densities.
Density Determination of Geological Materials
Scope: Applicable to materials like precious gems, stones, metals, and rocks.
Method: Principle of Archimedes is employed using a hydrostatic weighing scale. It aids in determining both the weight and volume of the sample, essential for calculating density.
Procedure:
- First, the sample is weighed in the air.
- The weighing is repeated after immersing the sample in water.
- The density is then calculated by the difference between the two weights, which corresponds to the volume of water displaced (equal to the sample’s volume).
8. Thermal Analysis of Soil
Thermal analysis measures changes in a substance’s physical property of soil, such as mass, as it undergoes a controlled temperature cycle.
Instrument Required:
- An ultra-precise thermal weigh-scales.
- A furnace with capabilities exceeding 1000 °C.
- A gas purging system ensures a controlled furnace atmosphere.
- An interfaced computer to record and analyze data.
- Sample Requirement: a few milligrams of soil sample.
Note: Thermal analysis of soil is has a destructive nature. Post-exposure to high temperatures, the sample’s properties alter, rendering it unfit for further testing.
Types of Thermal Analysis:
- Thermo-differential (dta) — common
- Thermo-gravimetry (tg) — common
- Emitted gases analysis (ega)
- Differential scanning calorimetry (dsc)
- Thermo-dilatometry (tda)
A. Thermo-differential Analysis (dta)
- Compares temperature differences between a test substance and an inert reference during a controlled temperature cycle.
- Useful for studying endothermic and exothermic phase transitions.
- Provides a spectrum: the ordinate axis shows temperature differences and the abscissa axis depicts increasing temperature or time.
- Peaks in the spectrum offer identification and quantitative insights.
- Key Reactions:
- Endothermic: Loss of water, CO2 from carbonates, phase transitions, melting, etc.
- Exothermic: Combustion of organic matter, re-crystallizations, structural transformations.
B. Thermogravimetric Analysis (tg)
- Assesses weight changes in a substance over time and temperature.
- Yields a thermo-gravimetric curve, indicating sample stability and components that might form during heating.
- Some instruments also display the curve’s derivative (dtg) to pinpoint reaction completions and the peak rate of weight change.
Applications:
- Provides both qualitative and quantitative information on components like clay minerals, carbonates, sulfates, and organics.
- Peaks from exothermic reactions vary based on plant types, their abundance, and their dehydration or decomposition states.
- Helps detect fertilizers, humus, and humic acids, along with ascertaining their maturity levels.
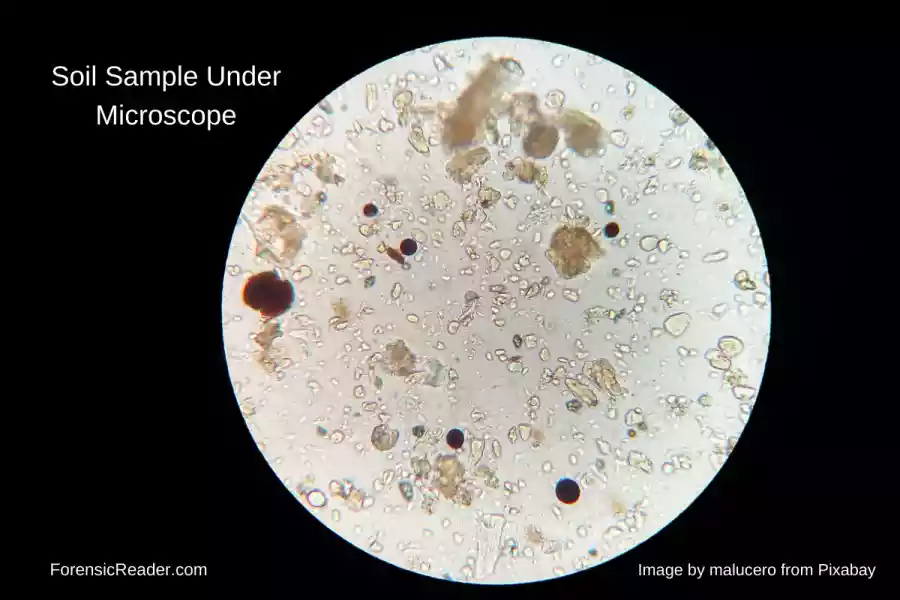
9. Stereoscopic Microscope Analysis of Soil
A stereo-microscope or stereoscopic microscope is designed to provide a spatial view of samples.
Design Features: Contains two separate optical paths to offer differently angled images for each eye. It primarily uses reflected light for studying thick or opaque objects. Modern variants also allow transmitted light for observing transparent 3D objects.
Advantages:
- Repeatable Examinations: Allows repeated studies of solid sample surfaces and uncovers details invisible to the naked eye.
- Magnification: Provides multiple magnification levels, even up to 250x. However, very high magnifications come at the expense of a reduced depth of field.
Application to Forensic Soil Science:
- Enables the study of morphological features of soil particles, such as angularity, brightness, shape, and other unique traits.
- Useful for observing, separating, and characterizing organic and anthropogenic components relevant to forensics.
- Observations often occur multiple times during analysis, including before and after treatments like ultrasonic baths and sieving.
Application to Forensic Geology:
- Used for analyzing other geological materials to study their morphological, geometric, and microscopic features.
- In gemology, it aids in examining cuts, face geometry, finish quality, inclusions, and structural distortions to determine gem purity.
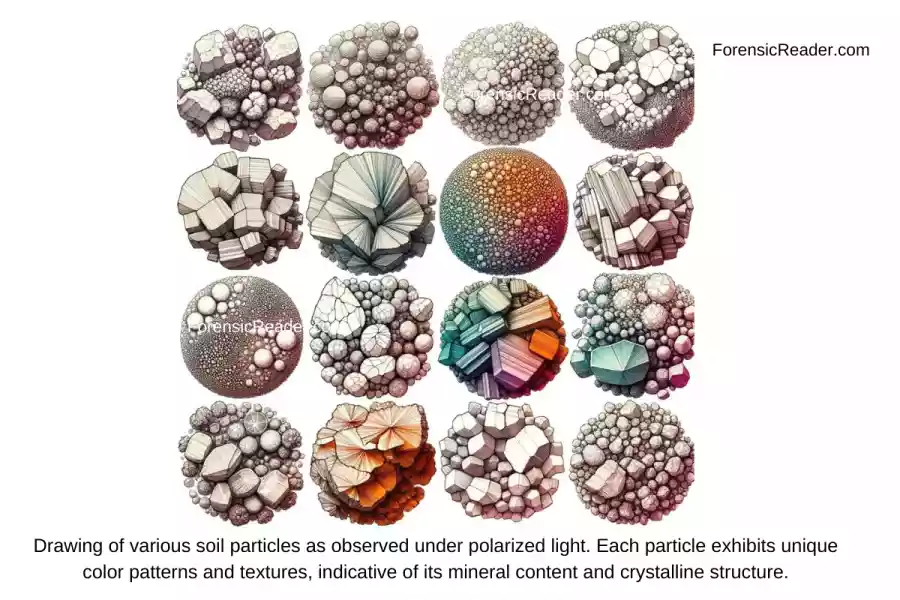
10. Analysis Soil Sample with the Polarizing Microscope
The polarizing microscope can decipher the optical properties of minerals through polarized light interferences. This allows specialists to precisely distinguish and categorize soil samples.
For example, they can differentiate between volcanic and sedimentary soils based on the birefringence patterns of their minerals
Common Application:
- Used for accurate identification of minerals and rock fragments in soil samples.
- Allows study of individual geological materials such as minerals, rocks, microfossils, and anthropogenic materials (e.g., cement, concrete).
Components and Functions
- Main Parts:
- Stand: Comprises of a base, an arm, and screws for focus adjustment.
- Optical System: Split into upper and lower parts, set around a rotating plate for specimens.
- Features:
- Equipped with light polarization and analysis systems.
- Can change the optical light path from straight (orthoscopic) to conical (conoscopic).
- Observation Mechanism:
- Uses transmitted polarized light, creating optical interferences when passing through crystal structures.
- Interferences arise due to the crystalline structure of minerals, offering characteristic data about the specific mineral species.
11. X-ray Diffraction Analysis of Soil
XRD allows for the identification of organic and inorganic compounds with a crystalline structure or materials that have atomic-level order and symmetry.
Fundamental of XRD
A. Working Principle:
- Based on the dispersion of x-ray radiation from a material when irradiated with a monochromatic x-ray beam.
- X-rays, having wavelengths akin to interatomic distances in crystalline phases, cause diffraction.
- Using a crystal for diffraction, one can determine the spatial distribution of atoms within the crystal’s elementary cell.
B. Powder Diffractometer:
- Most commonly used instrument for XRD.
- Uses a parallel and monochromatic x-ray beam on a pulverized sample.
- Radiation is diffracted at angles corresponding to each crystal’s interatomic space.
- A detector captures these radiations, converting them to electrical pulses. These are then processed by a computer to yield a diffraction spectrum or diffractogram.
- The diffractogram showcases peaks that relate to various crystalline phases in the sample, which are compared with a standard database for identification.
C. Quantitative Analysis:
- Using the Rietveld method, one can quantify the crystalline phases in a sample.
- This method demands calibration with reference samples or an understanding of the sample’s crystal structure.
Note: The Rietveld method is a quantitative X-ray diffraction analysis technique used to refine crystal structures. By comparing observed diffraction patterns to calculated ones, it determines atomic positions, thermal parameters, and atomic numbers in a crystalline sample. This method aids in both identification and quantification of crystalline phases within complex mixtures.
Advantages of the Powder Diffractometer in Soil Analysis
- Versatility:
- Allows XRD studies on fine aggregate or incoherent materials.
- Can measure a crystalline phase’s characteristics with minimal interference.
- Sample Preparation:
- Simple preparation if only qualitative analysis is needed: the material just needs to be ground.
- Only a tiny sample amount is necessary
- Material remains chemically unchanged during the analysis.
Applications in Forensic Geology
- Material Identification: Spotting geological materials with crystalline structures such as generic minerals, clay minerals, and rocks.
- Anthropogenic Material Analysis: Studying man-made materials with crystalline structures found in soils, like cement, bricks, and paints.
12. SEM-EDX Spectroscopy
SEM (Scanning Electron Microscopy) coupled with EDX (X-ray Microanalysis) is a non-destructive technique. It is used to determine the chemical elements in soil samples and study its morphological details.
Working Principles
- Primary Electron Generation:
- The sample is bombarded with primary electrons, created via thermionic effect.
- These electrons are accelerated by a varying potential difference (between 1 and 30 kV), collimated, and then scanned using a lens system.
- Electron Interaction & Phenomena: The interaction between primary electrons and the sample leads to:
- Emission of secondary and back-scattered electrons.
- X-ray, UV, and IR radiation signals.
- Information Gathering:
- Secondary Electrons: Give insights on the sample’s appearance and can create a grayscale three-dimensional image. The number of these electrons reflects the morphological characteristics of the examined area.
- Back-scattered Electrons: Offer insights into both the morphology and composition of the sample.
- X-rays: The energy of x-rays is specific to the atoms from which they emerge, allowing distinct identification of the material’s composition.
Observation Requirements & Capabilities
- Vacuum Creation: A vacuum is essential within the microscope to minimize interactions between electrons and gas molecules. Pressures range from 10−410−4 to 750 Pa.
- Magnification and Resolution:
- Modern microscopes can achieve magnifications between 150,000 and 200,000.
- Resolving power is around one-millionth of a millimeter, which translates to extremely detailed images, contrasting sharply with a high depth of field.
Applications
- Allows detailed analysis of minerals, gems, microfossils, rocks, metals, dust, and pollutants.
- Particle surface textures can reveal the soil sample’s probable origin and deposition environment, crucial for traceability and comparison.
- Gemology: Enables a meticulous examination of gem inclusions, structural deformations, and the precise identification of their composition.
- Metal Studies: Helps identify alloy elements and their precise percentages.
- Environmental Analysis: Assists in identifying and quantifying contaminants across various mediums (air, water, soil).
- Forensic Soil Science: Apart from identifying soil components, SEM-EDX offers a nuanced morphological analysis.
13. Raman Spectroscopy
Raman spectroscopy offers a non-invasive detailed molecular analysis of the soil’s composition. This technique enables researchers to distinguish between mineral phases and also detect trace contaminants.
For example, it can identify specific clay minerals or detect residues of agrochemicals in agricultural soils.
Foundations of Raman Spectroscopy
- Interaction with Electromagnetic Radiation: When monochromatic electromagnetic radiation hits an object, it interacts through:
- Reflection
- Absorption
- Scattering
- Scattering is minor due to molecule sizes being much smaller than visible radiation wavelengths.
- Scattering Types:
- Elastic Scattering: The scattered radiation retains the energy of the incident radiation.
- Inelastic Scattering (Raman Scattering): The scattered radiation possesses either more or less energy than the incident radiation.
- This form of scattering was first described by physicist C. V. Raman in 1930.
- The inelastic interactions that emit lower energy photons relate to the sample molecule’s functional groups and vibrations, assisting in the compound’s identification.
Raman Spectroscopy Technique
- Objective: To qualitatively study substances, be they solid, liquid, amorphous, crystalline, or gaseous.
- Equipment:
- Monochromatic laser source
- System to direct laser radiation onto the sample and collect the Raman signal
- System to segregate the Raman signal from elastically backscattered components
- Interferometer for simultaneous spectrum acquisition
- Detector
- Raman Spectrum: Appears as a series of peaks, akin to a digital fingerprint of the molecule. It facilitates identification by comparing with reference database spectra.
Applications in Soil Forensics
- Gemology:
- Identifies natural vs. synthetic gems.
- Detects treatments applied to enhance gem qualities (e.g., improving the color or transparency of diamonds to increase their market value).
- Studies gem inclusions and treatments meant to conceal flaws that significantly affect their worth.
- Mineralogy:
- Rapidly distinguishes mineral phases with akin chemical compositions and crystal structures.
- Precisely identifies distinct mineral phases in samples containing a mix of minerals.
14. FT-IR Spectroscopy
Fourier transform processing coupled with infrared absorption spectroscopy (FT-IR) is a technique used to study and uniquely identify the chemical bonds of both organic and inorganic materials. In short, it is used to decipher complex molecular structures.
Working Principle: Infrared photons are absorbed by molecules, leading them from a ground state to an excited vibrational state. The transition between these vibrational energy levels relates to the actual absorption intensity.
Analytical Process:
- The sample is exposed to a beam of infrared light within the wavelength range of 4,000–400 cm−1 (2.5–25 μm).
- Appropriate optical systems are used to select and record the absorption of specific frequencies, which are then plotted as a graph.
Analyzing the Results
- Infrared Absorption Peaks:
- The absorption frequencies in the infrared band reveal information about the functional groups within the sample molecules.
- Although the spectrum, which plots absorption intensity against wavelength, is an aggregate representation of the molecule, it features peaks specific to individual functional groups.
- The consistency of these peaks, and their unique absorption values, allow the reconstruction of the molecule’s structure.
- Information Type:
- Mainly qualitative data is derived.
- Quantitative data is majorly used for atmospheric pollutant studies.
Applications & Advantages
- Versatility: FT-IR spectroscopy is adaptive to various methodologies, enabling the analysis of organic or inorganic, crystalline or amorphous materials in any state (solid, liquid, and gaseous).
- Requires only small sample quantities.
- Allows for analysis in the sample’s natural state.
- Swift analysis and structural information acquisition.
- Useful for immediate recognition of a wide range of organic and inorganic compounds.
Case Studies Where Soil is Used as Evidence
1. The Case of Sarah Everard
In March 2021, a 33-year-old woman was murdered in London, England. Her body was found in a woodland area a week after she disappeared. One of the key pieces of evidence in the case was soil that was found on the suspect’s clothing and shoes.
Forensic scientists were able to compare the soil samples collected from the suspect’s attire to the soil samples from the crime scene and from other areas in the vicinity.
The analysis showed that the soil on the suspect’s clothing and shoes was a close match to the soil from the crime scene. This evidence helped to link the suspect to the crime scene and ultimately led to his conviction[6].
2. Case of Margarethe Filbert
Margarethe Filbert was a young woman who was murdered in Germany in 1912. Her body was found in a forest, and there were no witnesses to the crime. The police suspected her boyfriend, but they had no evidence to link him to the crime scene.
Forensic scientists examined the soil on the boyfriend’s shoes and found that it was a close match to the soil at the crime scene. This evidence was enough to convict the boyfriend[7].
3. Kidnapping of Jaycee Dugard
Jaycee Dugard was kidnapped in 1991 at the age of 11. She was held captive for 18 years before she was rescued in 2009[8].
Forensic scientists examined the soil at the kidnapping scene and found that it contained traces of the suspect’s DNA. This evidence helped to identify the suspect and to convict him of kidnapping.
4. Charlene Hummert Case
In 2004, Charlene Hummert was found strangled in Pennsylvania. While surveillance footage was vague, soil evidence became pivotal. Dirt on Charlene’s clothing was carefully analyzed by microscopist Skip Palenik, revealing traces of carborundum, magnetite, and iron.
These findings, indicating proximity to machinery work, combined with reference soil samples from her driveway, confirmed Charlene was attacked at her home.
This soil evidence, along with other findings such as a matching dog leash and linguistic analysis, led to her husband Brian’s arrest. The soil’s forensic analysis was key in pinpointing the crime’s location.
Read More: Charlene and Brian Hummert [A Tight Leash] Forensic Files Case Study
5. Drug Trafficking in the Colombian Rainforest
Drug traffickers often use the Colombian rainforest to transport and hide cocaine. Forensic scientists can use soil forensics to identify areas, road trails, or routes the drug traffickers are occurring[9].
6. Landslide at Mardol in Goa
In 2018, a landslide occurred at Mardol in Goa, India[10]. The landslide caused significant damage to property and infrastructure, and several people were injured.
Experts examined the soil at the landslide site and found that it was unstable due to a number of factors, including heavy rainfall, erosion, and hill cutting. Experts also found that the landslide was triggered by a nearby construction project.
References
- Mitchell, J. K., & Soga, K. (n.d.). Fundamentals of Soil Behavior.
- Rosa Maria Di Maggio, Pier Matteo Barone, Geoscientists at Crime Scenes: A Companion to Forensic Geoscience, Springer
- Forensic Pedology: From Soil Trace Evidence to Courtroom [SpringerLink]
- Lu, Y., Wang, X., Wang, M., Zhu, B., Zheng, M., Li, S., & Song, K. (2023). Soil color mapping based on Munsell system in the northeast of China [DOI]
- A Density Gradient Technique for Use in Forensic Soil Analysis [ResearchGate]
- The Tragic Story of Sarah Everard [The Organization for World Peace]
- Andre Schlicher and the Murder of Margarethe Filbert [Prezi]
- A world of nightmare: Jaycee Lee Dugard’s story [The Guardian]
- Drug trafficking in Colombia [Colombia Reports]
- Case Study and Forensic Investigation of Landslide at Mardol in Goa [Scribd]
- Schoeneberger, P. J., Wysocki, D. A., Benham, E. C., & Broderson, W. D. (Eds.). (2002). Field Book for Describing and Sampling Soils, Version 2.0. Natural Resources Conservation Service, National Soil Survey Center.

A Forensic Science graduate from Rashtriya Raksha University, and certifications in behavioral science, communication, and foreign languages. Known for her analytical proficiency and extensive field experience, solving real-world cases and presenting at prestigious conferences.

FR Author Group at ForensicReader is a team of Forensic experts and scholars having B.Sc, M.Sc, or Doctorate( Ph.D.) degrees in Forensic Science. We published on topics on fingerprints, questioned documents, forensic medicine, toxicology, physical evidence, and related case studies. Know More.